Bloomsbury Associates


Bloomsbury Winter Update 2026 April - June 2026
In this issue
- Introducing The Giving Gauge
- BrokerCheck: a free second opinion on your portfolio
- Market commentary
- Key market movements for the quarter
- Lessons from 100 years of capitalism
- Gillies McIndoe Research Institute
- Aotearoa New Zealand Festival of the Arts
- Like what you've read?
- Disclaimer
Introducing The Giving Gauge
We're excited to share the launch of The Giving Gauge, a free online tool designed to help New Zealanders answer one deceptively simple question: How much can I afford to give?
The initial round of data has been eye-opening: after using The Giving Gauge, 79% of users found they had the capacity to give, with a median annual giving capacity of $47,000.

In fact, 74% discovered they could give more than they currently do - the typical user able to give six times more than their present level, adding up to a median lifetime giving capacity of $1.17m. Half of users also plan to claim the donation tax credit; a benefit that remains underused, and one that could stretch giving even further.
Believed to be one of the first tools of its kind globally, The Giving Gauge helps individuals and families estimate a sustainable level of charitable giving based on their own financial circumstances, while still maintaining their lifestyle and long-term goals.
The idea grew from a recurring message Bloomsbury's founder, Philip Stevenson, has been asked.
"People often tell us they want to make a difference but also want to feel financially secure, and they don't know where to start."
Many assume philanthropy is only for the wealthy, when in reality generosity exists across all income levels.
By removing the uncertainty that can hold people back, The Giving Gauge aims to make giving a confident, empowering decision rather than a financial worry.
Our hope is that more Kiwis giving with confidence, even modestly, will add up to a meaningful collective impact for the charitable sector at a time when demand for services keeps rising.
The Giving Gauge is available free through the Bloomsbury Associates website.
BrokerCheck: a free second opinion on your portfolio
Alongside The Giving Gauge, we've launched another free tool: BrokerCheck, a no-obligation portfolio analysis for portfolios of $1 million or more.
The idea is simple. Upload a recent broker statement and our qualified advisers will review it properly; fees, performance, diversification, tax structure, and any signs of conflicts of interest. You'll get back a straight, honest assessment of what we find.
Because Bloomsbury Associates is an independent firm that doesn't take commissions or earn money from trading, the review comes with no strings attached. There are no meetings or lengthy questionnaires, the whole process is completely confidential, and there's no obligation to act on the report now or ever.
Access your free BrokerCheck through the Bloomsbury Associates website.
Market commentary
The best time to have a fire drill is when the building's not already burning.
The reason is simple, because any mistakes made during a drill are much less expensive than mistakes made during the real thing.
Why do we mention this?
Because if we can extend this analogy to investment markets, the markets were definitely not 'burning' in the second quarter of 2026. Far from it. Investors in fact have plenty of reasons to be very pleased about returns over the recent few months.
That's what makes this a good time to have an impromptu fire drill for investors.
Of course, when the markets inevitably hit their next difficult patch, it won't be a building you are looking to vacate, what you might be considering instead is exiting the markets themselves.
Don't. For genuine long-term investors, the best thing you can do is... not panic. Also, never assume that scary headlines will always have a negative impact on investment markets.
They might, but news gets rapidly assimilated into securities prices and forward-looking markets can be surprisingly quick to move on.
We were reminded of that once again last quarter.
A stalemate in the Strait
The war in Iran departed from the script the US had initially imagined. It was not the quick 4-5 week conflict they expected when bombing began in late February. While the conventional military phase was largely completed within that timeframe, the broader conflict didn't end. It morphed into a different type of war, where military strength mattered much less than time, politics, and local resistance.
In that phase, Iran's remaining leverage wasn't its army, it was geography - specifically its control over the Strait of Hormuz. By threatening any ships wanting to navigate this chokepoint for global oil supply, Iran was able to maintain significant supply uncertainty and send global energy prices sharply higher.
In that sense, after Iran's military was largely defeated, the Strait itself became the primary economic battlefield. As long as safe passage through the Strait remained uncertain, the conflict couldn't truly end from a market perspective.
This development, largely unanticipated by the Trump administration when the war began, was the collateral damage that spilled over into the global economy.
Accelerating inflation
Prior to the conflict, the world economy was experiencing moderate economic expansion and improving sentiment. This was a welcome development given the trade uncertainty and tariff-related price pressures that had characterised much of 2025.
However, the Middle East conflict dimmed the lights on the burgeoning economic recovery through its impact on commodity markets and inflation expectations. With a new energy shock pushing inflation expectations back up, the domino-effect was an abrupt sentiment change across major central banks.
While many central banks had previously been signalling an intention to continue reducing interest rates to encourage growth, the conflict caused many of these rate plans to quickly be put on ice. In some cases, consideration was even given to increasing interest rates.
As investors priced in a higher likelihood that interest rates would remain elevated for longer, global bond yields rose and bond prices fell.
The paradox of share market returns
As the second quarter progressed, it became clear that the balance of global economic risks had changed.
The world was observing hostilities in the Middle East that showed no signs of resolving quickly and this was contributing to higher oil prices, and a deteriorating inflation outlook.
None of this would generally be considered 'good news' for share markets.
However, in the face of these headwinds, investors demonstrated resilience. Share markets, which are often more inclined to go down when global risks increase, decided to throw a party.
The US S&P 500 (total return index) went up by 15.2% during the quarter, Australasian share markets went up 5-6% and the MSCI Emerging Markets (gross index in USD) went up by a stunning 24.1%.
It's returns like these that torpedo the idea that market forecasting is the pathway to investment outperformance. Even if someone could have accurately predicted the Iran war, oil price spike and rapidly changing inflation expectations, they - most likely - would have believed that selling out of shares would have been the best approach.
It's not enough just to be right about the economic information that will arrive in the future. To be successful, you would also need to correctly predict how markets will react.
Why were these share markets so strong over the last three months?
The most likely reasons were a combination of:
- Still strong underlying corporate earnings (i.e. businesses remained profitable even though sentiment was weaker)
- Continued heavy global investment in technology, infrastructure and defence spending (generally considered to be supportive for share markets)
- Share markets are themselves 'forward looking'. They focus less on the headlines of today, and far more on longer term market prospects (i.e. a return to pre-conflict oil prices and growth rates).
The New Zealand perspective
In the middle of the second quarter the Reserve Bank of New Zealand's (RBNZ) monetary policy committee met for its scheduled 27 May review of the Official Cash Rate (OCR).
Immediately before the Iran war (on 28 February) interest rates in New Zealand were expected to be held at the existing level of 2.25% for some time, to assist with the fledgling economic recovery underway.
At the following meeting (8 April), just six weeks after hostilities commenced, the RBNZ decided to hold interest rates steady, but explicitly warned that rate rises could soon be required.
By the 27 May meeting, the decision had reduced to coin-toss. The RBNZ ultimately held rates steady again, albeit by a split vote of three to three. Interestingly, the three internal members of the committee all voted to keep the OCR unchanged, while the three external members favoured a 0.25% increase. Governor Anna Breman broke the deadlock with her casting vote ultimately delivering the 'on-hold' decision.
While there was disagreement amongst the committee on the appropriate timing of a hike, there was broad agreement that further interest hikes were now imminent, and the market moved to price an interest rate hike in July as a near certainty.
This eventuated immediately after the end of the quarter when, in their 8 July meeting, the RBNZ lifted the OCR by 0.25% to 2.50%.
In spite of a rapid decline in oil prices following the late June de-escalation of the Middle East conflict, the RBNZ observed that the effects of the earlier oil price rises would linger and that the outlook for medium-term inflation remained uncertain. They also stated that some "further reduction in monetary stimulus is likely to be required", leading most local economists to project the OCR finishing 2026 somewhere between 2.75% and 3.00%.

Voting with their feet
Migration statistics are regularly reported in the media with the data often being used to comment on whether New Zealanders are generally happy to stay and live here or see greater opportunities overseas. The data is also relevant to certain sectors of the economy. For example, new migrants can bring much needed skills, and positive net migration can often result in increased demand for residential housing and higher house prices.
However, like all statistics, migration data can easily be interpreted to suit a particular social or political narrative.
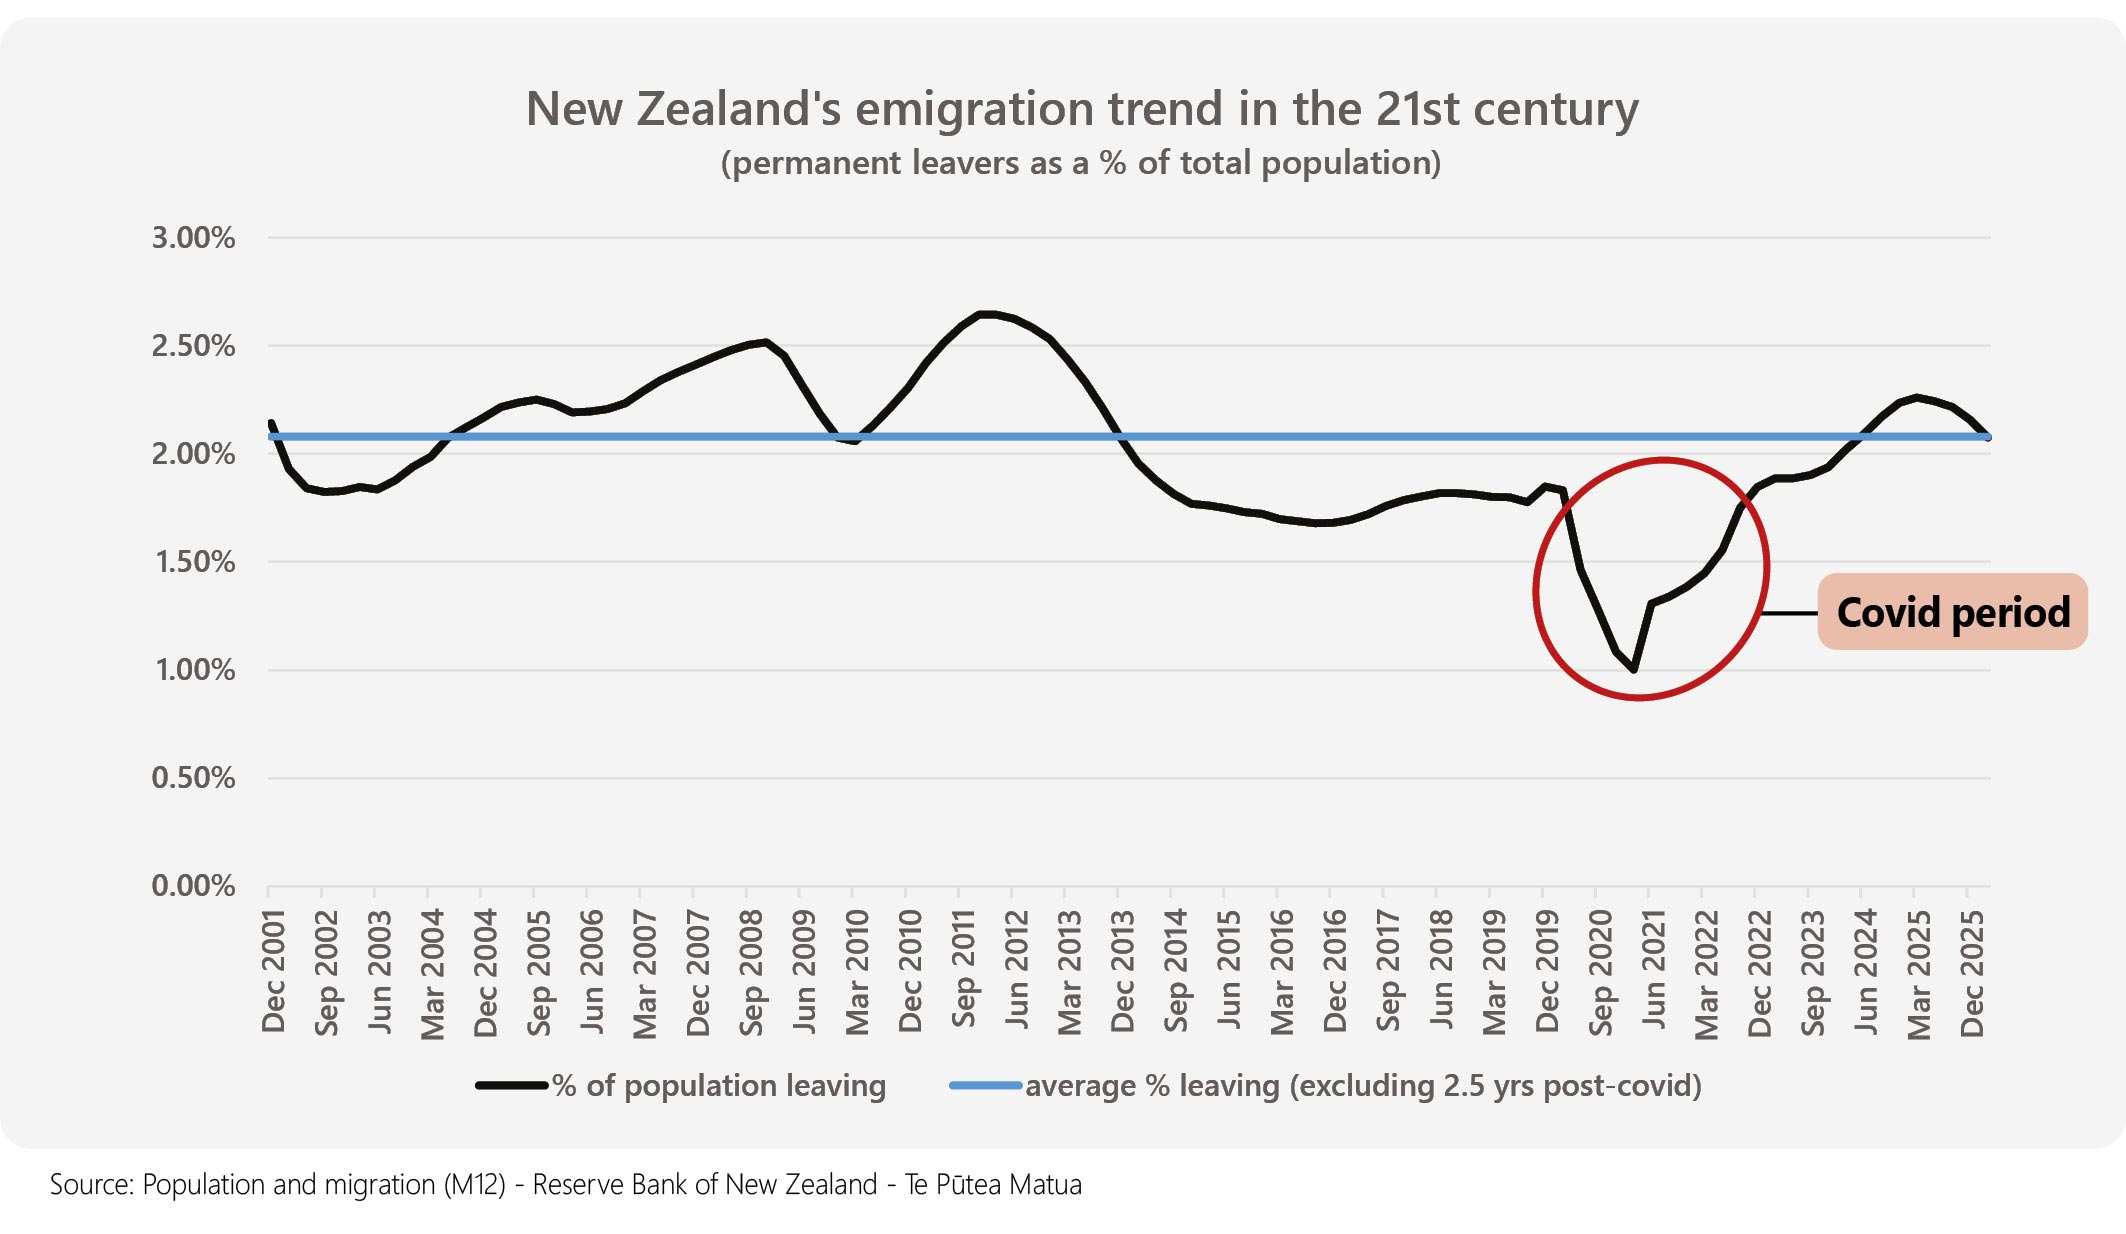
In recent times, media commentary has focused on "why are so many Kiwis leaving?" It seems a fair question when the statistics show that permanent emigrants (people leaving) increased from around 50,000 in March 2021 to over 110,000 in March 2026. That's a sizable increase, but it's also not the full picture.
New Zealand's population has steadily grown over time, and it's reasonable that the average number of people arriving and leaving in any year will naturally grow over time as well. It's only when we look at the number of permanent emigrants as a percentage of the population that we can get a better perspective.
The annual percentage of the total population leaving New Zealand is highlighted by the solid black line in the chart below.
New Zealand's emigration trend in the 21st century
Source: Population and migration (M12) - Reserve Bank of New Zealand - Te Pūtea Matua
See larger version of this image
The blue dotted line shows annual average percentage of the population leaving. When calculating this average, we excluded the data from March 2020 and September 2021 (the period highlighted in the shaded circle). We have removed this period because this was when the world was first locked down, and subsequently recovering from, the Covid-19 pandemic. Emigration was artificially much lower then because of a combination of border closures and greater limitations on international travel.
When emigration is assessed as a percentage of the underlying population, New Zealand's data now looks entirely reasonable. Contrary to some of the recent headlines, New Zealanders aren't suddenly leaving the country in droves.
Over the 21st century so far, New Zealanders have permanently left our shores at an average rate (excluding covid) of 21 people per 1,000. The very latest government statistics to the end of March 2026, showed that over the prior 12 months the emigration rate was also 21 people per 1,000.
This means New Zealand's current emigration rate is bang on its long run average. Completely, utterly, and boringly, normal.
It's also worth noting that new migrants over the last 12 months outpaced emigrants by just over 24,000 so the New Zealand population continues to grow. Taken together, these trends confirm that New Zealand remains a highly desirable place to live, by global standards. Stable emigration and still positive net migration also underpins the future economic growth and prosperity of New Zealand Inc.
Key market movements for the quarter
June 2026
The second quarter of 2026 delivered exceptional returns across most major equity markets, with both developed and emerging markets posting some of their strongest quarterly gains in recent years. Two themes dominated the period: the AI investment boom and the gradual de-escalation of the Middle East conflict.
Risk sentiment improved materially as the price of oil, which had peaked sharply in April, began to retreat following a ceasefire agreement announced in June. This eased supply disruption fears that had weighed on markets and pushed inflation expectations higher for much of the year. Against this improving backdrop, global corporate earnings proved resilient, with the US first-quarter earnings season delivering strong results and the AI capital expenditure cycle continuing to underpin broad earnings revisions higher across several sectors.

International shares
International developed market shares delivered outstanding gains over the second quarter of 2026, with the MSCI World ex Australia Index returning +13.6% hedged and +15.3% unhedged. The divergence between the hedged and unhedged returns reflects a continued weakening of the New Zealand dollar relative to the basket of major currencies over the period, which added to the returns for investors with unhedged foreign currency exposure.
US shares posted strong gains, supported by the robust earnings season and the AI capital expenditure narrative. The Federal Reserve held its benchmark federal funds rate steady at 3.50%-3.75% at its April and June meetings, acting on its dual mandate in an environment of solid economic activity but elevated inflation. Despite the more cautious policy outlook, the earnings and AI investment cycle proved sufficient to sustain equity market momentum through the period.
European shares also rallied strongly over the quarter as energy supply concerns eased and consumer confidence recovered from April lows. UK shares lagged other developed market regions due in part to the British share market's relatively large exposure to the energy sector, whose earnings prospects were weighed on by the decline in oil prices.
Japan's equity market continued its recovery, supported by the beneficial effect of the weaker yen on Japanese exporters' earnings. The Bank of Japan raised its policy rate by 25 basis points to 1.0% in June in response to persistent yen weakness and growing concerns that higher energy cost pressures were feeding through to broader producer prices. While the yen strengthened marginally on the announcement, it remained at historically weak levels, continuing to provide a competitive tailwind for Japanese exporters.
Source: MSCI World ex Australia Index (net div.)
Emerging markets shares
Emerging market shares delivered an exceptional second quarter of 2026, with the MSCI Emerging Markets Index returning +25.5% in NZD terms, taking it's twelve month return to a staggering +54.0%. These are the highest returns from this index over any 3 or 12 consecutive month period since early 2006. The performance was overwhelmingly driven by the technology-oriented markets of South Korea and Taiwan, both of which benefited from the powerful AI investment theme.
South Korea was the standout performer of the quarter. The KOSPI Index gained 68% over the three months, with index heavyweights SK Hynix and Samsung Electronics delivering extraordinary share price gains as demand for AI memory chips and semiconductors surged. Taiwan similarly delivered, with TSMC and other semiconductor and electrical equipment companies driving the Taiwanese market materially higher as investor demand for AI-exposed shares remained intense.
China's market underperformed the broader emerging market index over the quarter. Weakness in the retail and auto sectors weighed on sentiment, and the broader domestic consumption recovery remained uneven. The MSCI China index lagged the group materially, in contrast to the strong performance seen across Northeast Asian technology markets.
The divergence between China and its technology-heavy peers underscored that emerging market gains during the quarter were concentrated, driven predominantly by AI and semiconductor exposure rather than widespread economic optimism across the asset class.
Source: MSCI Emerging Markets Index (net div.)
New Zealand shares
The New Zealand share market posted a solid second quarter of 2026, with the S&P/NZX 50 Index (Gross with Imputation) returning +5.6%. While this represents a healthy gain in absolute terms, local market returns lagged those of developed and emerging international markets, reflecting New Zealand's limited exposure to the AI and technology themes that dominated global investor attention during the period. The index reached record highs over the course of the quarter, extending the recovery that has been underway since 2025.
The domestic economic backdrop provided a mixed but broadly supportive environment for New Zealand shares. The Reserve Bank of New Zealand (RBNZ) held the Official Cash Rate (OCR) steady at 2.25% at both its April and May review meetings, although has subsequently increased the rate at their 8 July meeting. The stable OCR during the second quarter provided a predictable backdrop for sectors most affected by interest rates, including utilities, real estate, and infrastructure companies, which represent a significant portion of our local share market.
New Zealand shares continue to offer a relatively defensive and income-oriented return profile compared to international markets, and the modest underperformance versus global peers during the quarter reflected the structural difference in sector composition rather than any deterioration in domestic conditions.
Source: S&P/NZX 50 Index (Gross with Imputation)
Australian shares
Australian shares delivered a positive second quarter of 2026, with the S&P/ASX 200 Total Return Index gaining +5.6% in NZD terms. Like New Zealand, the Australian market lagged its international peers materially, given the Australian market's heavier weighting toward resources, financials, and other value-oriented sectors that were less directly exposed to the technology rally driven by AI investment that powered global returns during the quarter.
The Reserve Bank of Australia left its cash rate target unchanged at 4.35% at its June meeting, pausing after three consecutive rate increases earlier in 2026 that had reversed the easing cycle delivered in 2025.
The financials sector was the largest positive contributor to Australian market returns. Australian banks benefited from the global trend toward AI-driven capital markets activity and demonstrated resilient earnings, with credit quality remaining broadly stable despite the higher rate environment. The information technology sector was also among the better performers on the ASX, albeit comprising a relatively low proportion of the market. This was a reflection of the same AI-related tailwind that drove technology shares globally. Energy and materials sectors delivered mixed outcomes. While the initial spike in oil prices in April benefited energy producers, the subsequent decline as ceasefire expectations emerged removed some of that tailwind, and the sector's contribution to overall returns was modest by quarter-end.
Source: S&P/ASX 200 Index (Total Return)
International fixed interest
FTSE World Government Bond Index 1-5 Years (hedged to NZD): +0.5%
Bloomberg Global Aggregate Bond Index (hedged to NZD): +1.0%
Global bond markets delivered modest positive returns in the second quarter of 2026, with the FTSE World Government Bond Index 1-5 Years (hedged to NZD) returning +0.5% and the broader Bloomberg Global Aggregate Bond Index (hedged to NZD) returning +1.0%. Elevated inflation, driven largely by the sharp rise in energy costs during the Middle East conflict, kept central banks cautious and prevented yields from declining materially.
In the US, government bond yields were broadly stable through the quarter, with the 10-year bond moving mildly higher to 4.42%. The Fed's decision to hold rates steady at 3.50%-3.75% in June was broadly anticipated, but its policy stance remained cautious while inflation stayed above target. Despite this, the labour market remained relatively stable, limiting the concern that wage-driven inflation would compound the energy price shock.
In Europe, the European Central Bank's decision to raise its deposit rate to 2.25% was well-flagged and well-received by markets. European government bonds performed slightly better than their American counterparts, with falling inflation expectations - as oil prices began to retreat from their April highs - and a weaker growth outlook providing support for bond prices.
The most significant development in global fixed income came from Japan. The Bank of Japan's (BOJ) June rate hike to 1.0% - the highest policy rate since 1995 - drove Japanese Government Bond (JGB) yields materially higher. JGBs underperformed the broader global bond index over the quarter, as persistent yen weakness, rising producer prices, and the BOJ's clear commitment to policy normalisation contributed to upward pressure on yields.
In credit markets, spreads tightened across both investment grade and high yield bonds globally, supported by the strong corporate earnings environment and improving risk sentiment, which partially offset duration-related pressures.
Sources:
FTSE World Government Bond Index 1-5 Years (hedged to NZD)
Bloomberg Global Aggregate Bond Index, hedged to NZD
New Zealand fixed interest
New Zealand fixed interest delivered solid returns in the second quarter of 2026, outperforming the major international bond indices. The S&P/NZX A-Grade Corporate Bond Index returned +2.5%, reflecting a combination of stable short-term rates, the residual benefit of the RBNZ's completed cutting cycle, and continued investor demand for investment-grade domestic credit.
The RBNZ held the OCR unchanged at 2.25% at both the April and May meetings during the quarter. This was consistent with Governor Breman's late 2025 guidance that the OCR was likely to remain at this level for some time if economic conditions evolved as expected. Yields drifted down over the quarter leading to strong returns from domestic debt, especially securities with longer duration.
The New Zealand corporate bond market benefited from continued investor appetite for domestic credit. Corporate bonds outperformed government bonds over the quarter, as tighter credit spreads amplified returns relative to the risk-free curve. New Zealand companies continued to issue debt into a receptive market, with strong domestic demand for investment-grade fixed income securities.
The higher return from corporate bonds relative to cash and international fixed income reflected both the additional credit spread available on domestic investment-grade issuers and the relatively modest change in the underlying New Zealand yield curve through the quarter.
Source: S&P/NZX A-Grade Corporate Bond Index
Table 1: Asset class returns to 30 June 2026
| Asset class | Index name | 3 months | 1 year | 3 years | 5 years | 10 years |
|---|---|---|---|---|---|---|
| International shares | MSCI World ex Australia Index (net div., hedged to NZD) | 13.6% | 21.4% | 18.8% | 11.5% | 13.2% |
| International shares | MSCI World ex Australia Index (net div.) | 15.3% | 30.4% | 22.5% | 16.3% | 15.9% |
| Emerging markets shares | MSCI Emerging Markets Index (net div.) | 25.5% | 54.0% | 26.2% | 11.7% | 12.6% |
| New Zealand shares | S&P/NZX 50 Index (gross with imputation credits) | 5.6% | 8.8% | 5.4% | 2.3% | 8.0% |
| Australian shares | S&P/ASX 200 Index (total return) | 5.6% | 19.8% | 15.0% | 10.6% | 11.2% |
| International fixed interest | FTSE World Government Bond Index 1-5 years (hedged to NZD) | 0.5% | 1.8% | 4.0% | 1.6% | 1.9% |
| International fixed interest | Bloomberg Global Aggregate Bond Index (hedged to NZD) | 1.0% | 1.7% | 3.6% | 0.2% | 1.7% |
| New Zealand fixed interest | S&P/NZX A-Grade Corporate Bond Index | 2.5% | 5.1% | 6.3% | 2.7% | 3.2% |
| New Zealand cash | New Zealand One-Month Bank Bill Yields Index | 0.6% | 2.7% | 4.3% | 3.7% | 2.5% |
Unless otherwise specified, all returns are expressed in NZD. We assume Australian shares and emerging markets shares are invested on an unhedged basis, and therefore reported returns from these asset classes are susceptible to movement in the value of the NZD. Index returns are before all costs and tax. Returns are annualised for time periods greater than one year.
Lessons from 100 years of capitalism
If you had invested in the US share market over the past century, you would have participated in one of the greatest wealth creation stories ever recorded.
A dollar broadly invested in the US share market 100 years ago would have compounded by a staggering 1,500,000% over the course of the century. It's an extraordinary statistic.

At a glance, it looks like success must have been a sure thing for US share market investors.
But beneath that amazing headline return sits a result that is far less intuitive. Most individual shares did not deliver strong outcomes for investors and would have underperformed even very low risk alternatives.
That dichotomy between strong market outcomes and weaker results for individual shares, is one of the most important ideas for investors to understand.
What the data actually shows
The following insights are based on research by Hendrik Bessembinder, who studied 29,754 individual shares listed in the US between 1926 and 2025.1
Two findings from Bessembinder's work stand out:
- The number of shares not producing any wealth
About 60% of the companies failed to create wealth for investors relative to US Treasury bonds, which are about the safest investment going in the US. - The very small number of shares that produced the majority of the wealth
The 1,500,000% compound return is heavily influenced by a small number of exceptional performers.
These results are not unusual, it's just that 100 years of data makes the results really stand out. This gap between the 'average' and 'typical' outcomes is the normal way equity markets work.
The few companies that drive the market
Let's dig into the Bessembinder's findings in more detail. Over the full century, total shareholder wealth increased by approximately $91 trillion US Dollars. That is $91,000,000,000,000!
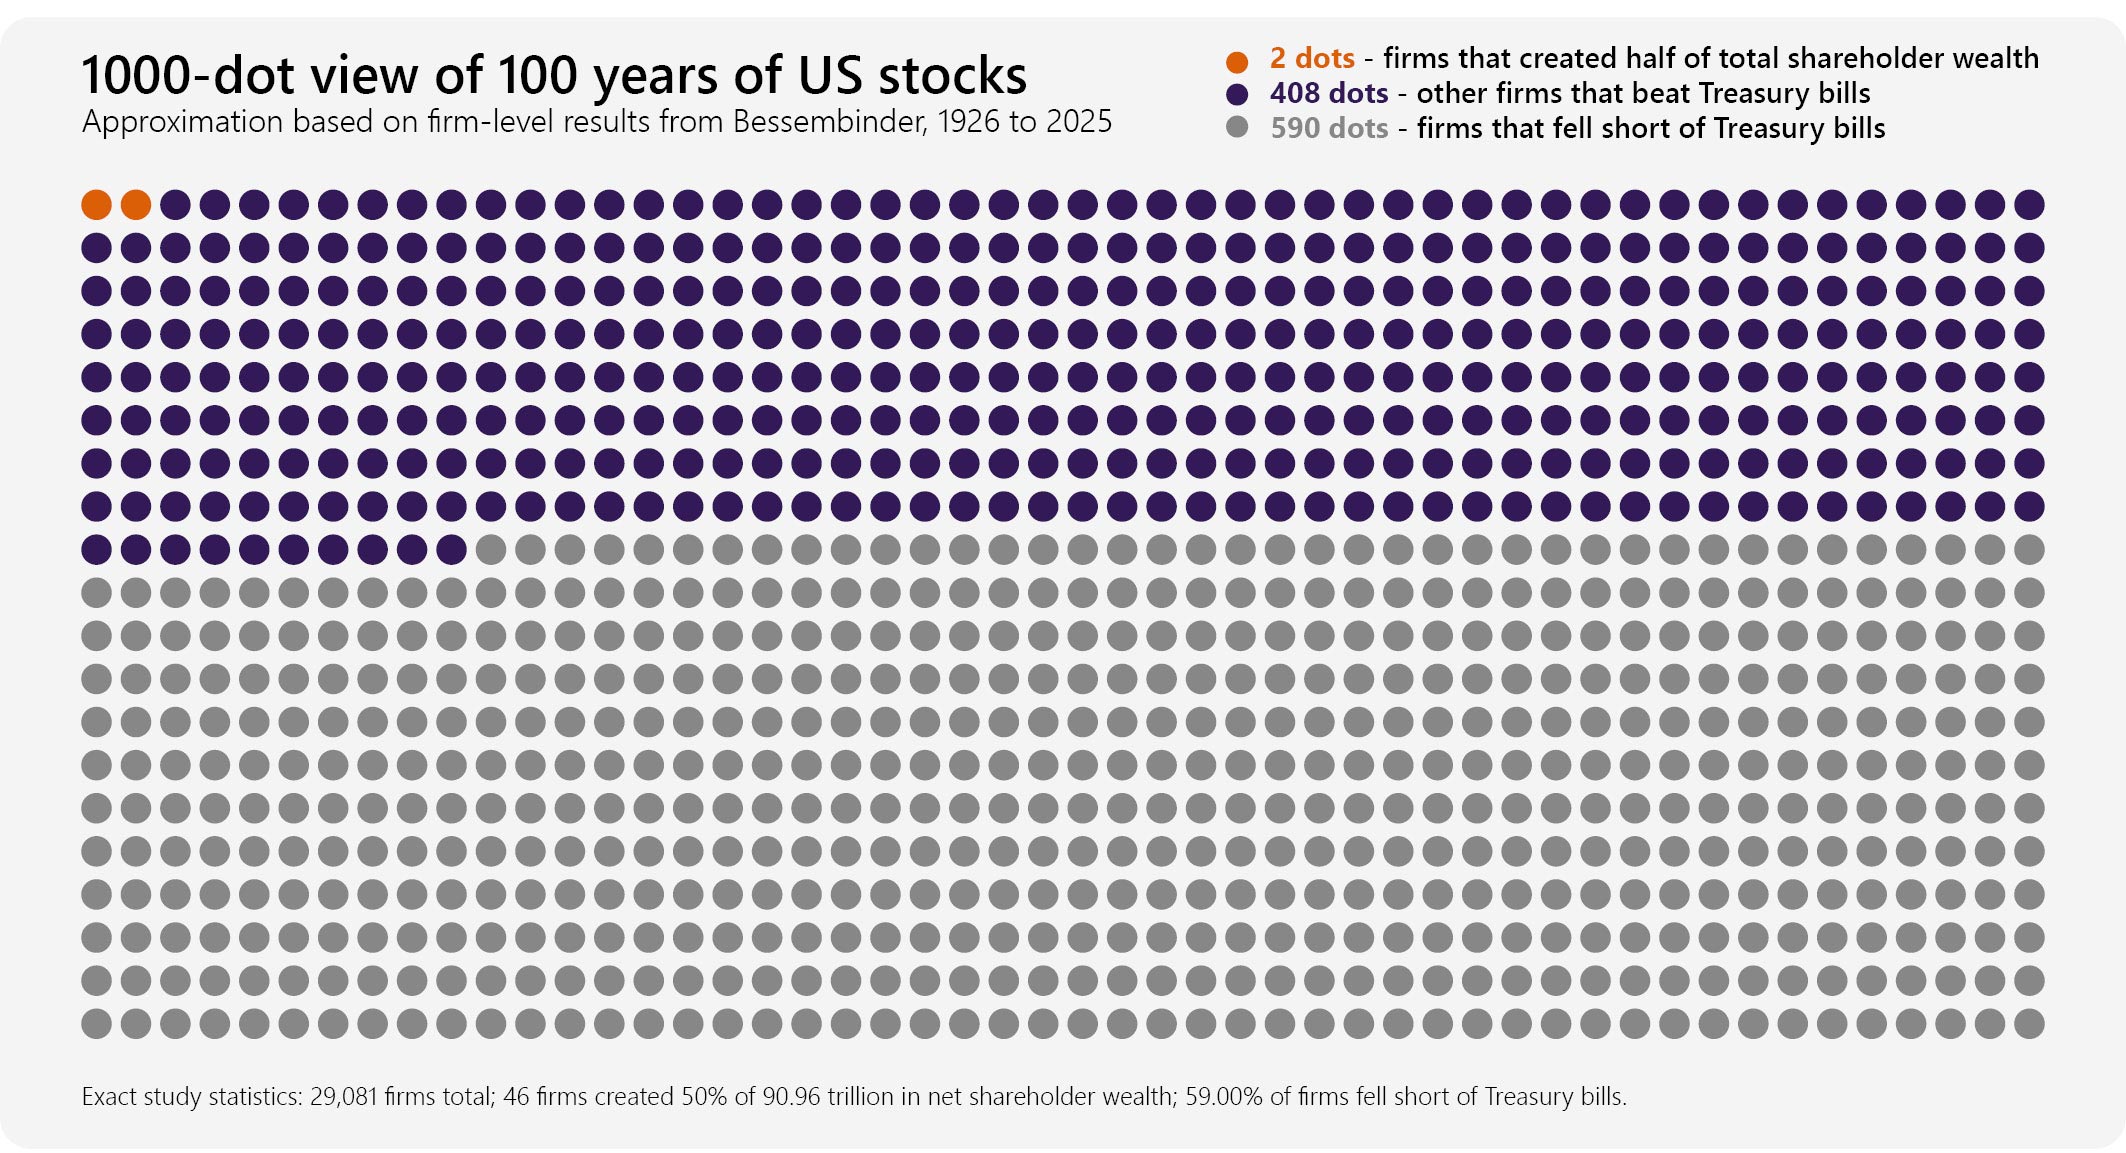
But this wealth was not created evenly. Out of nearly 30,000 listed companies, just 46 accounted for half of that total wealth creation.
The graphic below illustrates this using 1,000 dots to proportionally represent the nearly 30,000 listed companies in the US share market which created this $91,000,000,000,000 of wealth. Based on ratios, just 2 of the 1,000 dots created half of this wealth, 408 dots had returns better than Treasury Bills and 590 dots had returns lower than Treasury Bills.
1000-dot view of 100 years of US stocks
Exact study statistics: 29,081 firms total; 46 firms created 50% of $90.96 trillion in net shareholder wealth; 59.00% of firms fell short of Treasury bills.
See larger version of this image
That's an extraordinary level of concentration. It means the overall success of the share market was not driven by widespread success across thousands of companies. It was driven by a very small number of exceptional businesses that delivered sustained, long-term growth.
Everything else... the successes, the failures, the companies that went nowhere... is secondary.
A useful way to picture this is to imagine a winning cricket team where one player scores 300 runs while the rest contribute very little. The team score looks impressive on paper, but the result is driven almost entirely by one standout performance. That's how equity markets work. Over the long term, a small number of companies deliver extraordinary outcomes, and those few successes dominate the result for the entire market.
The implication for investors
This creates a simple but uncomfortable reality. If you are investing in individual shares, the odds are not naturally in your favour.
At any point in time, you are selecting shares to own from a pool where the majority of outcomes will be mediocre or poor, and only a very small proportion of companies go on to deliver truly exceptional results.
The challenge is not just identifying those companies. The challenge is also owning them for long enough to benefit from their success, while avoiding, as much as possible, the large number of companies that will disappoint.
In hindsight, the winners are easy to identify. Apple, Microsoft, Amazon and others appear obvious today. But before their extraordinary runs, their eventual success was less obvious. Who would have bet on Microsoft against IBM? Who would have thought Apple of the late 1990's would overtake Microsoft?
This is what makes successful share picking so difficult. It is not just about being right. It is about being right early, staying right through uncertainty, and avoiding being wrong in the much larger number of cases where things do not work out. A contrarian spirit is also required because if everyone agrees with you, the share price will already be high, diluting the potential big gains.

Why diversification matters
Once you understand this market characteristic, the role of diversification becomes much clearer.
Diversification is often described as a way to reduce risk, and that is true. But that description misses something more important. Diversification is how you guarantee having exposure to the small number of companies that actually drive long-term returns without having to know in advance who they are. It acknowledges that markets are uneven, outcomes are uncertain, and success is concentrated. Don't search for the needle. Buy the haystack.
The gap between theory and behaviour
Despite this evidence, many investors in New Zealand remain drawn to concentrated portfolios. This is understandable when stories that dominate headlines are the outliers. The natural impression is that identifying winners is easier than it actually is.
In our experience, concentrated portfolios feel purposeful to investors. They create the illusion that large gains are possible for those 'in the know'. They give a sense of control and follow the common-sense narrative, "why buy the junk?"
In contrast, diversification can feel boring. It does not produce dramatic individual success stories or bragging rights. It does not generate the same sense of excitement. But, diversification aligns much more closely with how wealth is actually created in markets over time, and it automatically gives you exposure to the companies that will drive future performance, including those we haven't yet heard of.
What this means for portfolio construction
When you accept that returns are driven by a small number of companies, portfolio construction is more straightforward.
The objective is not to predict which companies will succeed. The objective is to ensure exposure to the full opportunity set. That means building portfolios that are globally diversified, spread across sectors, and structured to capture market returns over time.
This is the philosophy that underpins our approach. Rather than attempting to pick individual winners, the focus is on constructing portfolios that reflect the broad market and allow the strongest companies to contribute naturally as they emerge.
This approach removes the need to be consistently correct about the prospects of individual companies. Instead, it relies on a process that captures the aggregate outcome of markets, which, as the data shows, has been both resilient and powerful over long periods.
References
- Hendrik Bessembinder, One Hundred Years in the U.S. Stock Markets (2026), extending his earlier work, Do Stocks Outperform Treasury Bills? (2018).
Gillies McIndoe Research Institute
A milestone year for doctoral researchers at Gillies McIndoe
The Gillies McIndoe Research Institute, an independent biomedical research organisation based in Wellington, New Zealand, is celebrating an important year of achievement and growth within its research community.
Dr Ibrahim Yakubu recently passed his final oral exam and has completed all requirements for his doctorate to be awarded. His doctoral research explored the long-term effects of preterm birth on liver development and metabolism. Ibrahim is now working at Wellington Regional Hospital.
Two further doctoral researchers, Raka Mitra and Jasmine White, have submitted their theses and are preparing for their oral examinations.
Raka's research focused on infantile haemangioma, a common vascular tumour of infancy. She developed a novel three-dimensional laboratory model and investigated sex-related differences in the condition's underlying biology. Raka has now accepted a postdoctoral position at the Institute, where she will continue developing her research career.
Jasmine investigated the mechanisms that may contribute to treatment resistance in glioblastoma, an aggressive brain cancer. After completing her doctorate, she plans to move to the United Kingdom to pursue a career in clinical research.
The Institute has also welcomed a new doctoral researcher, Marco Massimino, who joins the team from Italy. His research will focus on venous malformations under the supervision of Raka Mitra, Dr Clint Gray, Dr Helen Fitzsimons and Dr Tracy Hale.
Two additional doctoral researchers are expected to join the Institute soon, marking an exciting period of growth.

From left: Dr Ibrahim Yakubu, Raka Mitra, Jasmine White and Marco Massimino
Our charity: Gillies McIndoe Research Institute
The Gillies McIndoe Research Institute is investigating new treatment options for patients with brain cancer, vascular birthmarks, and keloid scars. Help us to help them continue this vital work to make effective, affordable treatment a reality for patients who need it most.
Aotearoa New Zealand Festival of the Arts
Wellington Jazz Festival
14-18 Oct, 2026 | jazzfestival.nz
This year from Wed 14 - Sun 18 October, the Capital will once again come alive with the spirit of jazz at the 2026 Wellington Jazz Festival!
Last year the Wellington Jazz Festival brought 200+ jazz-inspired events to various venues around the city. Registrations for the City Line-up have already opened for musicians and venues to be a part of New Zealand's biggest jazz celebration.
With the early announcement of Macy Gray joining the First Release line-up, stay tuned for the remaining acts to be announced in August.
Find out more - Wellington Jazz Festival

Macy Gray
2026 Kiri Te Kanawa Song Quest
Samuel Mataele, 19 year old countertenor from Auckland has been named the winner of the 2026 Kiri Te Kanawa Song Quest. Samuel is the first ever countertenor and youngest (along with 19 year old Anne Rasmussen who won in 1967) to win the Song Quest in its 70 year history.
Along with Samuel, runner-up, soprano Sarah Mileham, and third place winner, tenor Samuel Downes were also announced on the night by International Head Judge Frederica von Stade, one of the world's most acclaimed mezzo-sopranos, who praised the exceptional standard of this year's six finalists.
This year marked a new chapter for the iconic competition, which was presented as the Kiri Te Kanawa Song Quest for the first time. Since 1956, the Song Quest has helped nurture generations of New Zealand singers, including Dame Kiri Te Kanawa herself, Dame Malvina Major, Jonathan Lemalu, Phillip Rhodes, Amitai Pati and Filipe Manu.
The next Kiri Te Kanawa Song Quest will take place in 2028.
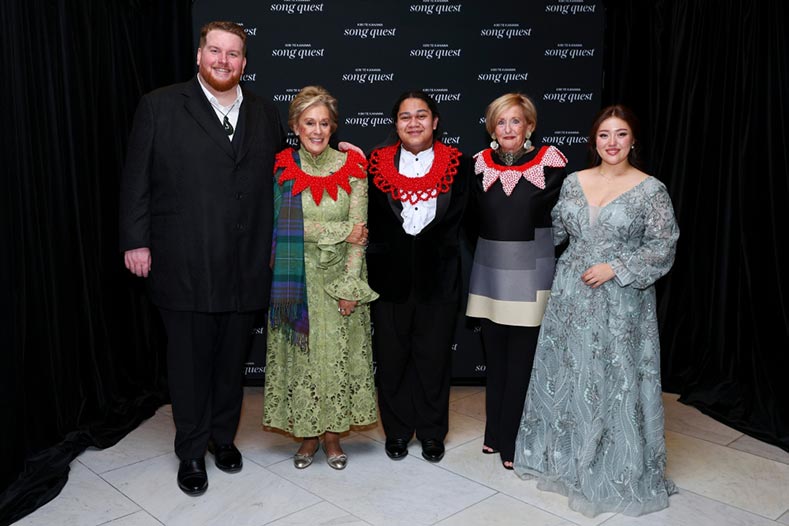
From left: Third place winner Samuel Downes, Dame Kiri Te Kanawa, Winner Samuel Mataele, International Head Judge Frederica von Stade, runner-up Sarah Mileham.
Photo by Hagen Hopkins.
Our arts charity: Aotearoa New Zealand Festival of the Arts
We are proud to be the inaugural Patron Partner of the Aotearoa New Zealand Festival of the Arts. Our hope is through philanthropy to have an impact on the arts and for our clients to experience well-being through the awe and wonder of culture and creativity spanning all art forms. Find out more about our Patron Partnership.
Like what you've read?
Please feel free to pass this update on to friends and colleagues who may enjoy it...
If you would like to talk about anything discussed in these articles further, please feel free to call or email.
Phone: +64 4 499 6979
Email: info@bloomsbury.co.nz
Disclaimer
This document has been provided for general information purposes only.
The information in this brochure does not constitute personalised financial advice for any person nor does it constitute advice of a legal, tax, accounting or other nature to any persons. Recipients should seek professional advice before taking any action.
This brochure is based on information obtained from sources believed to be reliable and accurate at the time of preparation, but its accuracy and completeness is not guaranteed.
Any information, analysis or views contained herein reflect our opinion at the date of publication and are subject to change without notice.
None of Bloomsbury Associates Limited ("BAL"), its directors, officers, employees, agents or associates accept any liability whatsoever for any errors or omissions; or for any direct or indirect loss or damage of any kind arising out of the use of, or reliance on, the information provided in this brochure.
Past performance is not indicative of future results, and no representation or warranty, express or implied, is made regarding future performance. Investments are volatile and may fluctuate in that values can go down as well as up and investors may get back less than originally invested.
None of BAL, its directors, officers, employees, agents, associates or any other person guarantees the securities referred to in this brochure or the performance of those securities.
BAL, its directors, officers, employees, agents and associates may hold securities mentioned in this brochure (or related securities) as principal for their own account.
This brochure may only be distributed to investors in New Zealand and other jurisdictions to whom, under relevant law, this brochure may be lawfully distributed.

Bloomsbury Associates is a CEFEX certified firm